
The User Journeys screen shows the actual paths visitors take through your site — the page-to-page sequences within a single session. Open it from Traffic → Journeys.
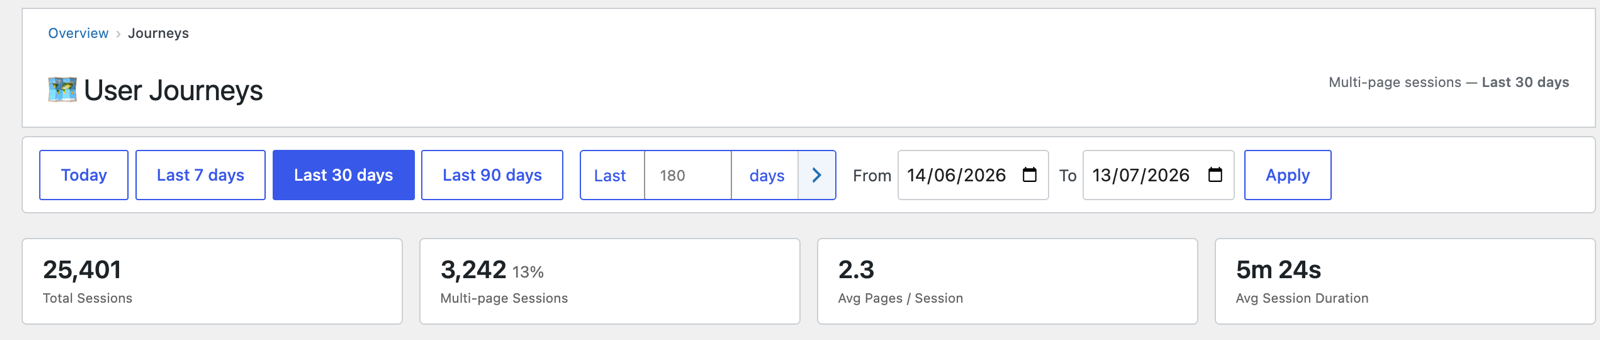
Headline cards
- Total Sessions in the period.
- Multi-page Sessions — sessions with 2+ pages (and their share). Only these produce a journey.
- Avg Pages / Session and Avg Session Duration.
The routes table
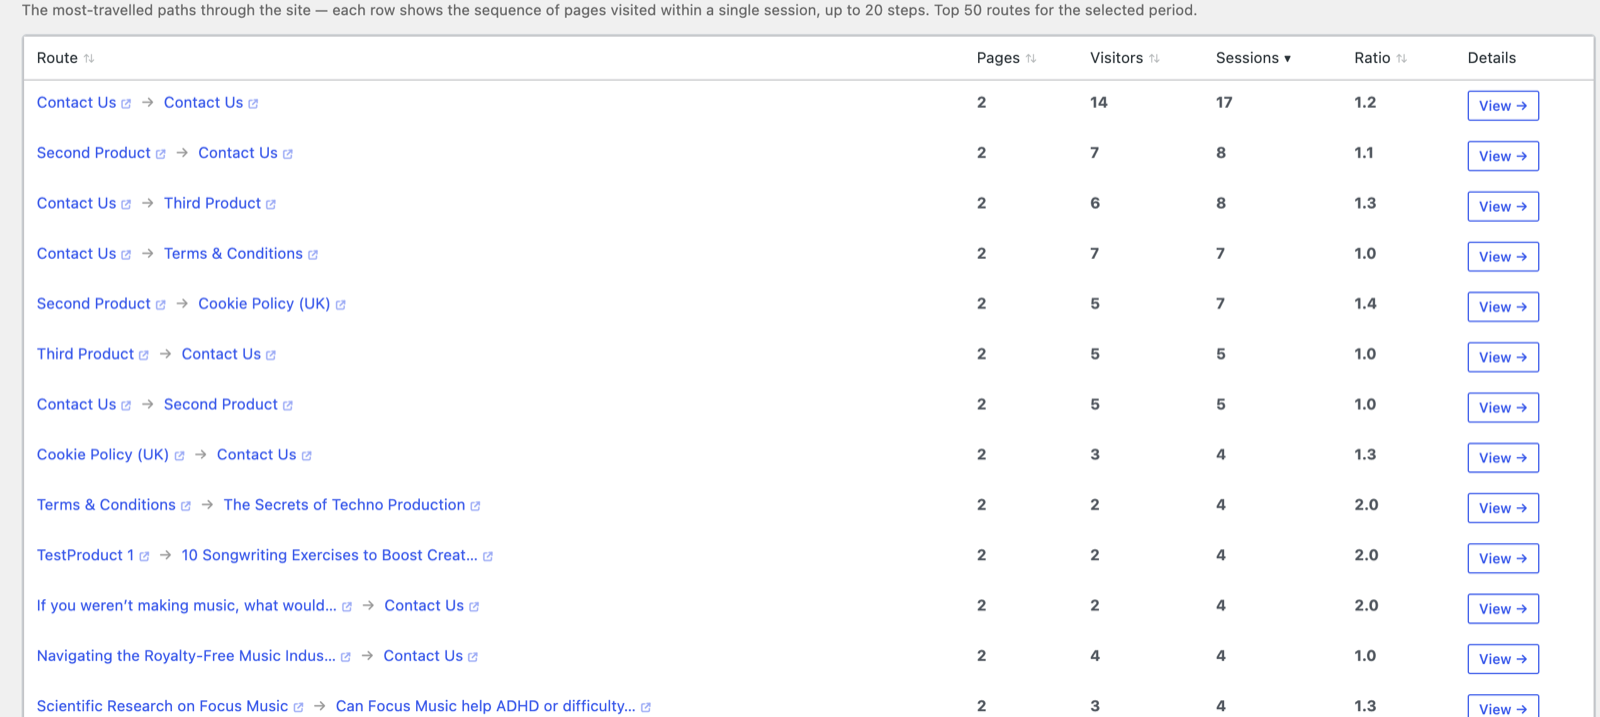
Each row is a distinct route — the ordered sequence of pages visited in one session (e.g. Second Product → Contact Us), up to 20 steps. Columns:
- Route — the page sequence; each page name opens the live page on your site (new tab), so you can walk the route exactly as the visitor did.
- Pages — how many steps in the route.
- Visitors and Sessions — how many took this exact path.
- Ratio — sessions per visitor for the route (how often, on average, the same visitor repeated this exact path); always 1.0 or higher.
- Details → View — opens the journey’s detail, including the individual sessions that followed it (and from there, each session’s own page-by-page breakdown and the visitor’s chip → profile).
It lists the top 50 routes for the selected period, sorted by sessions.
What it tells you
- Common next steps — what people look at after your key pages, which informs internal linking and calls to action.
- Unexpected paths — routes you didn’t design for, revealing how visitors actually explore.
- Pre-conversion paths — combined with Goals and WooCommerce, the routes people take before converting.
Next: Media: plays & downloads →
Screenshots are illustrative — see the note on the documentation index.