
When WooCommerce is active, PAJ adds a WooCommerce menu with revenue analytics, a checkout funnel, and product/attribution insights — tying your store performance to the traffic that drives it. (This is a Pro feature, and these screens only appear when WooCommerce is installed.)
WooCommerce Overview
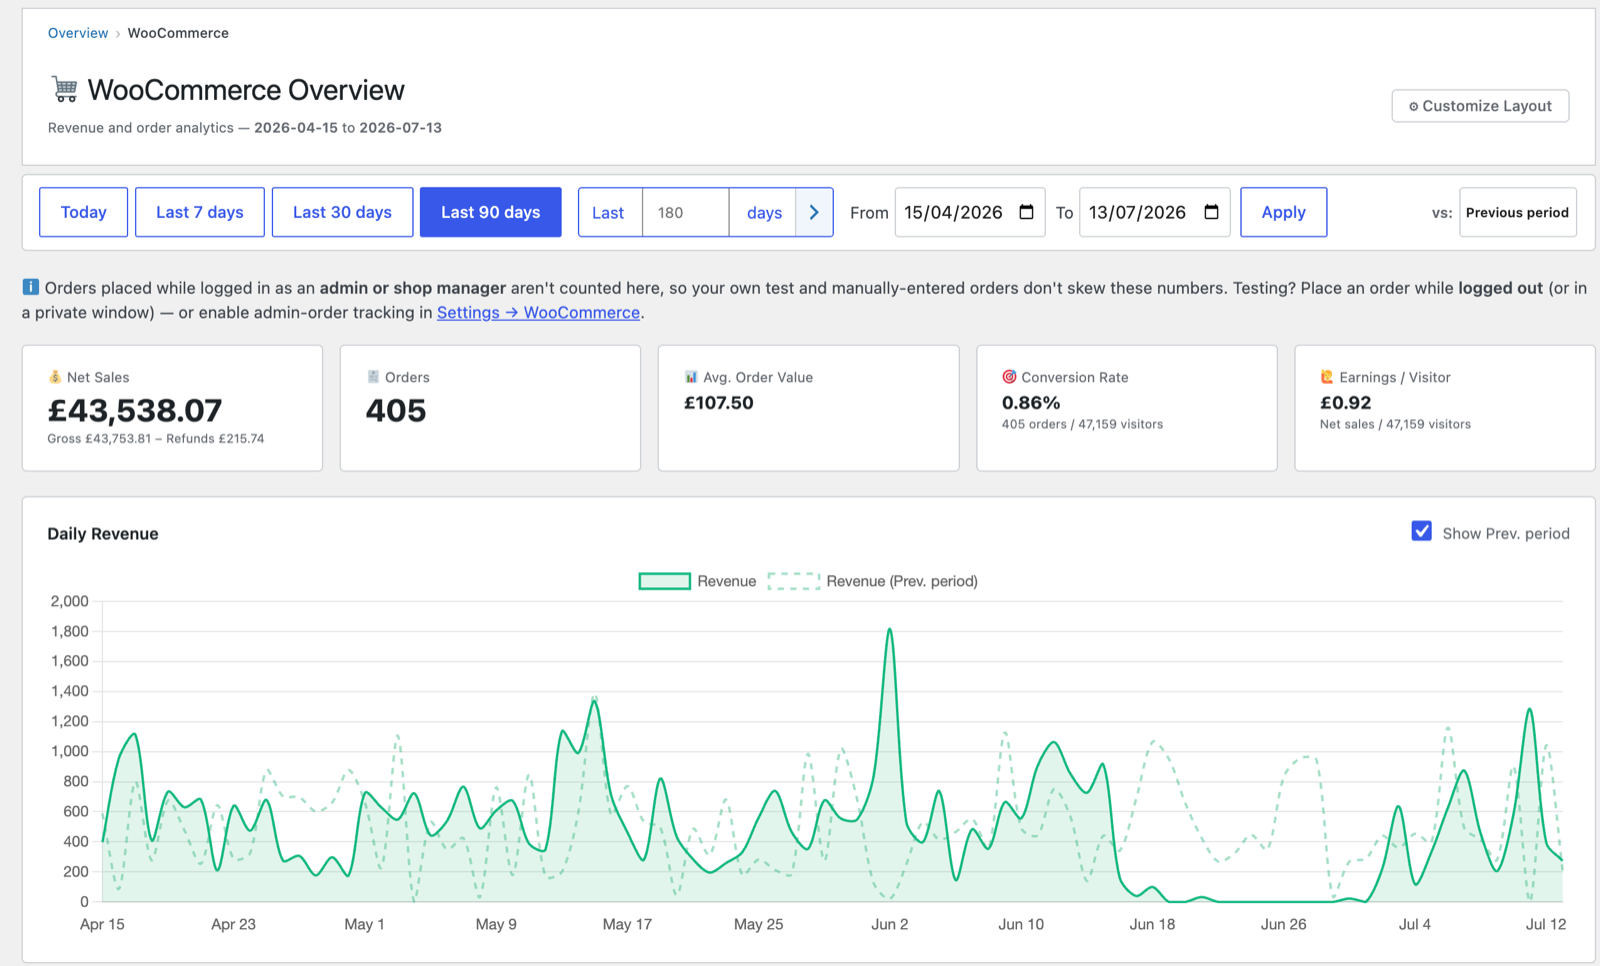
The store headline screen (WooCommerce → WC Overview):
- Net Sales — with gross and refunds shown beneath.
- Orders, Avg Order Value.
- Conversion Rate — orders ÷ visitors.
- Earnings / Visitor — net sales ÷ visitors, a useful single measure of how well traffic monetises.
- Daily Revenue chart with optional previous-period overlay.
Important: orders placed while logged in as an admin or shop manager
aren’t counted, so your own test/manual orders don’t skew the numbers. To test,
order while logged out (or in a private window), or enable admin-order tracking
in Settings → WooCommerce.
Below the chart you’ll find top products, revenue by source/country/campaign, landing pages by revenue, and first-vs-last-touch attribution.
Checkout Funnel
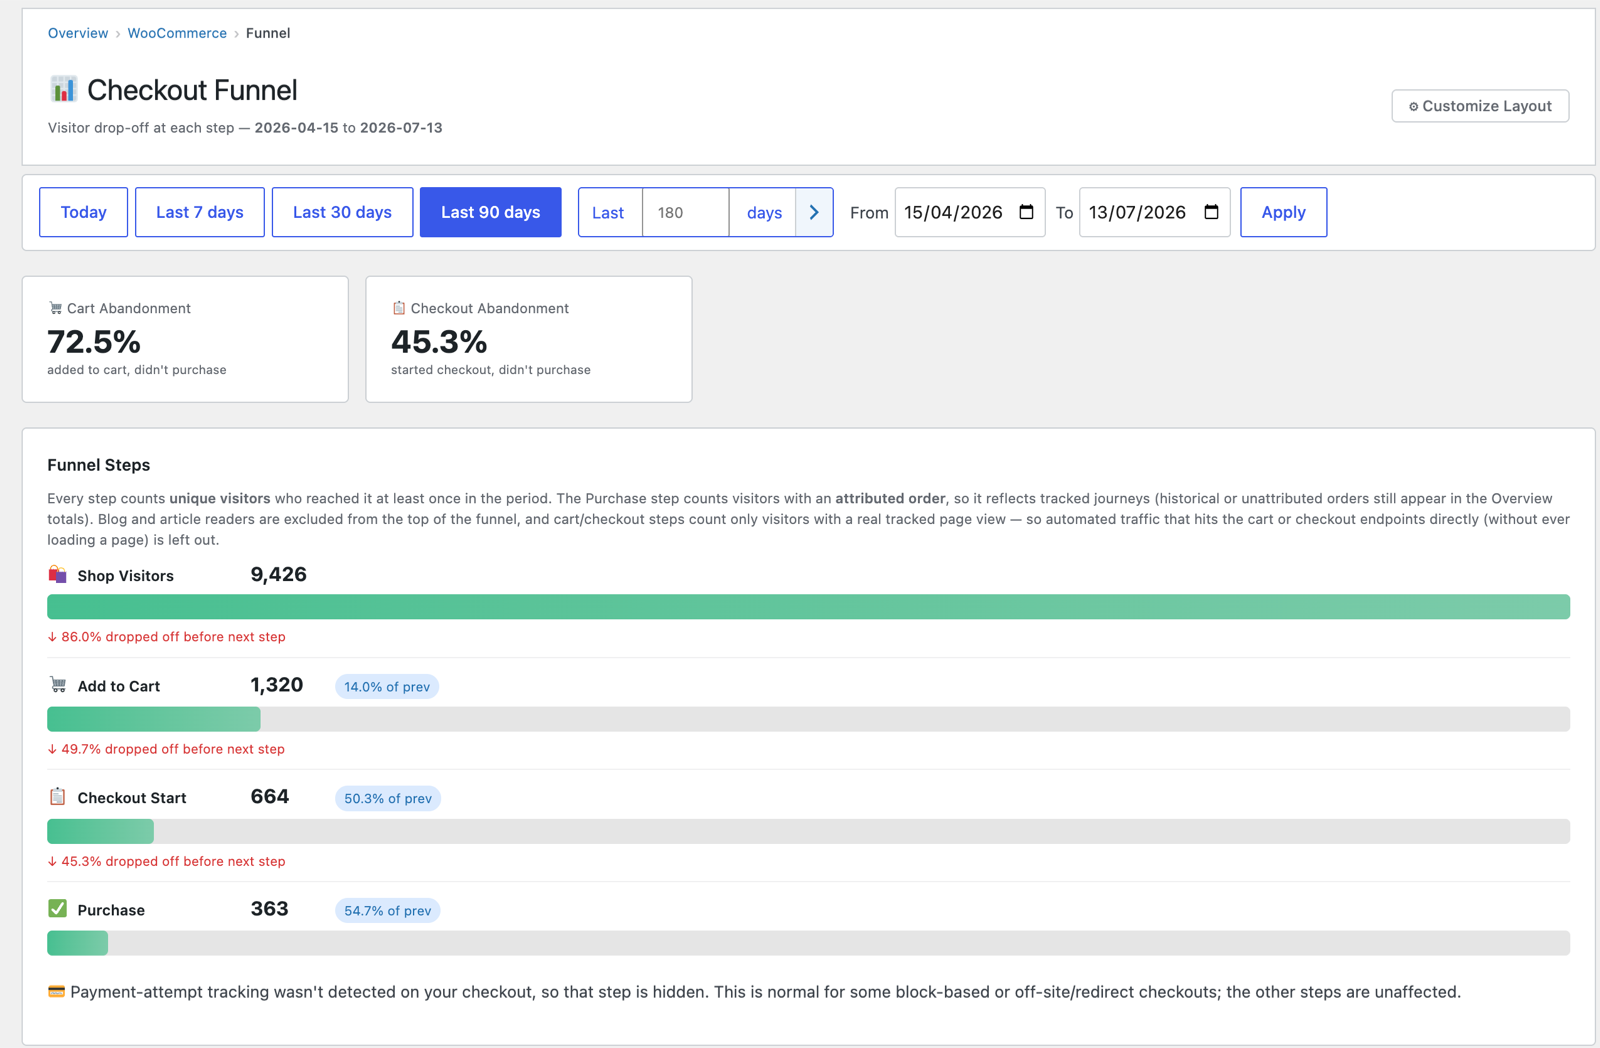
The funnel (WooCommerce → WC Funnel) shows where shoppers drop off on the way to a purchase:
- Cart Abandonment and Checkout Abandonment rates up top.
- Funnel Steps: Shop Visitors → Add to Cart → Checkout Start → Payment Attempted → Purchase — each with its count, its share of the previous step, and the drop-off to the next step.
How the steps are counted. Every step counts the unique visitors who reached it. “Shop Visitors” (the top) counts everyone who engaged with the shop — viewed a shop/product page, added to cart, started checkout, or placed an order — so it is always a true superset, and the funnel can never invert (you’ll never see more add-to-carts than shop visitors). “Purchase” counts visitors with an attributed order; blog and article readers are excluded from the top.
Payment Attempted may not appear. That step relies on your checkout firing a
standard WooCommerce order-processed hook. Some **block-based or off-site/redirect
checkouts** don’t fire it, so when the step clearly isn’t being captured PAJ
hides it automatically (with a short on-screen note) rather than show a
misleading gap. Every other step is unaffected.
Occasionally a step can legitimately exceed the one above it (e.g. a “buy now” flow that skips the cart). PAJ shows the real figure with a ⚠ marker rather than rounding it down, so the numbers stay honest.
Abandoned Carts & Abandoned Checkouts
Below the funnel, these tables list the sessions that added to cart (or started checkout) but never purchased — when it happened, what was in the cart, and the visitor’s coloured chip. Click the chip to open that visitor’s full profile and see the whole story around the abandonment: what they read before, whether they came back later, and whether a later session converted. (Identities are privacy-preserving chips, not names — see Understanding your metrics.)
Product Performance
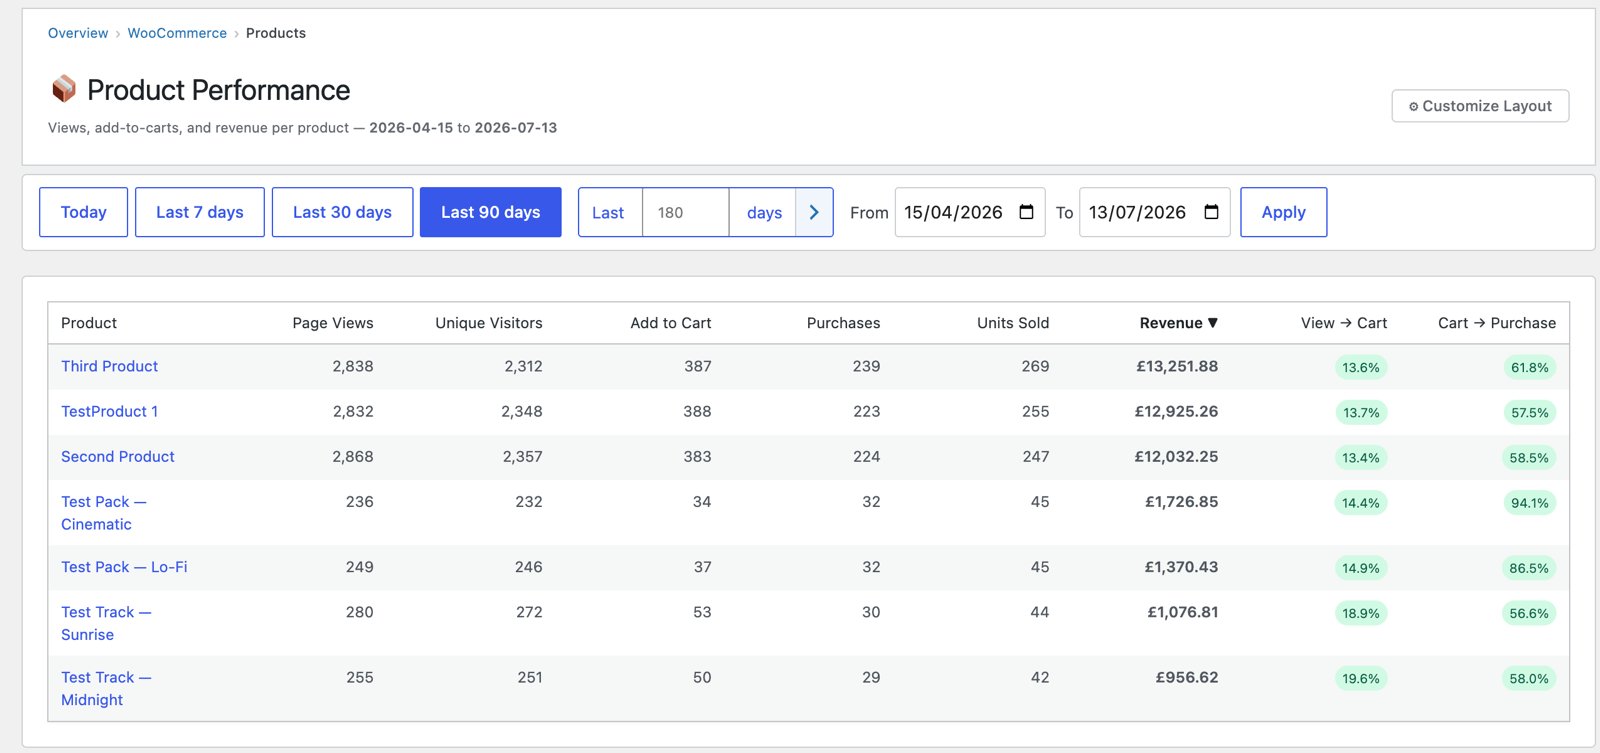
The per-product table (WooCommerce → WC Products) turns each product into a mini-funnel of its own, sortable by any column:
- Page Views and Unique Visitors — how much attention the product got.
- Add to Cart, Purchases, Units Sold — the demand it converted.
- Revenue — money it actually earned.
- View → Cart — the share of product-page views that became an add-to-cart.
- Cart → Purchase — the share of add-to-carts that became a sale.
Reading the two rates together tells you where a product leaks. A high View → Cart but low Cart → Purchase means people want it but something at checkout (price, shipping, stock) stops them; the reverse — low View → Cart, high Cart → Purchase — means the product page isn’t selling the click, but everyone who does add it, buys. Click any product name to open its live page.
WooCommerce Insights
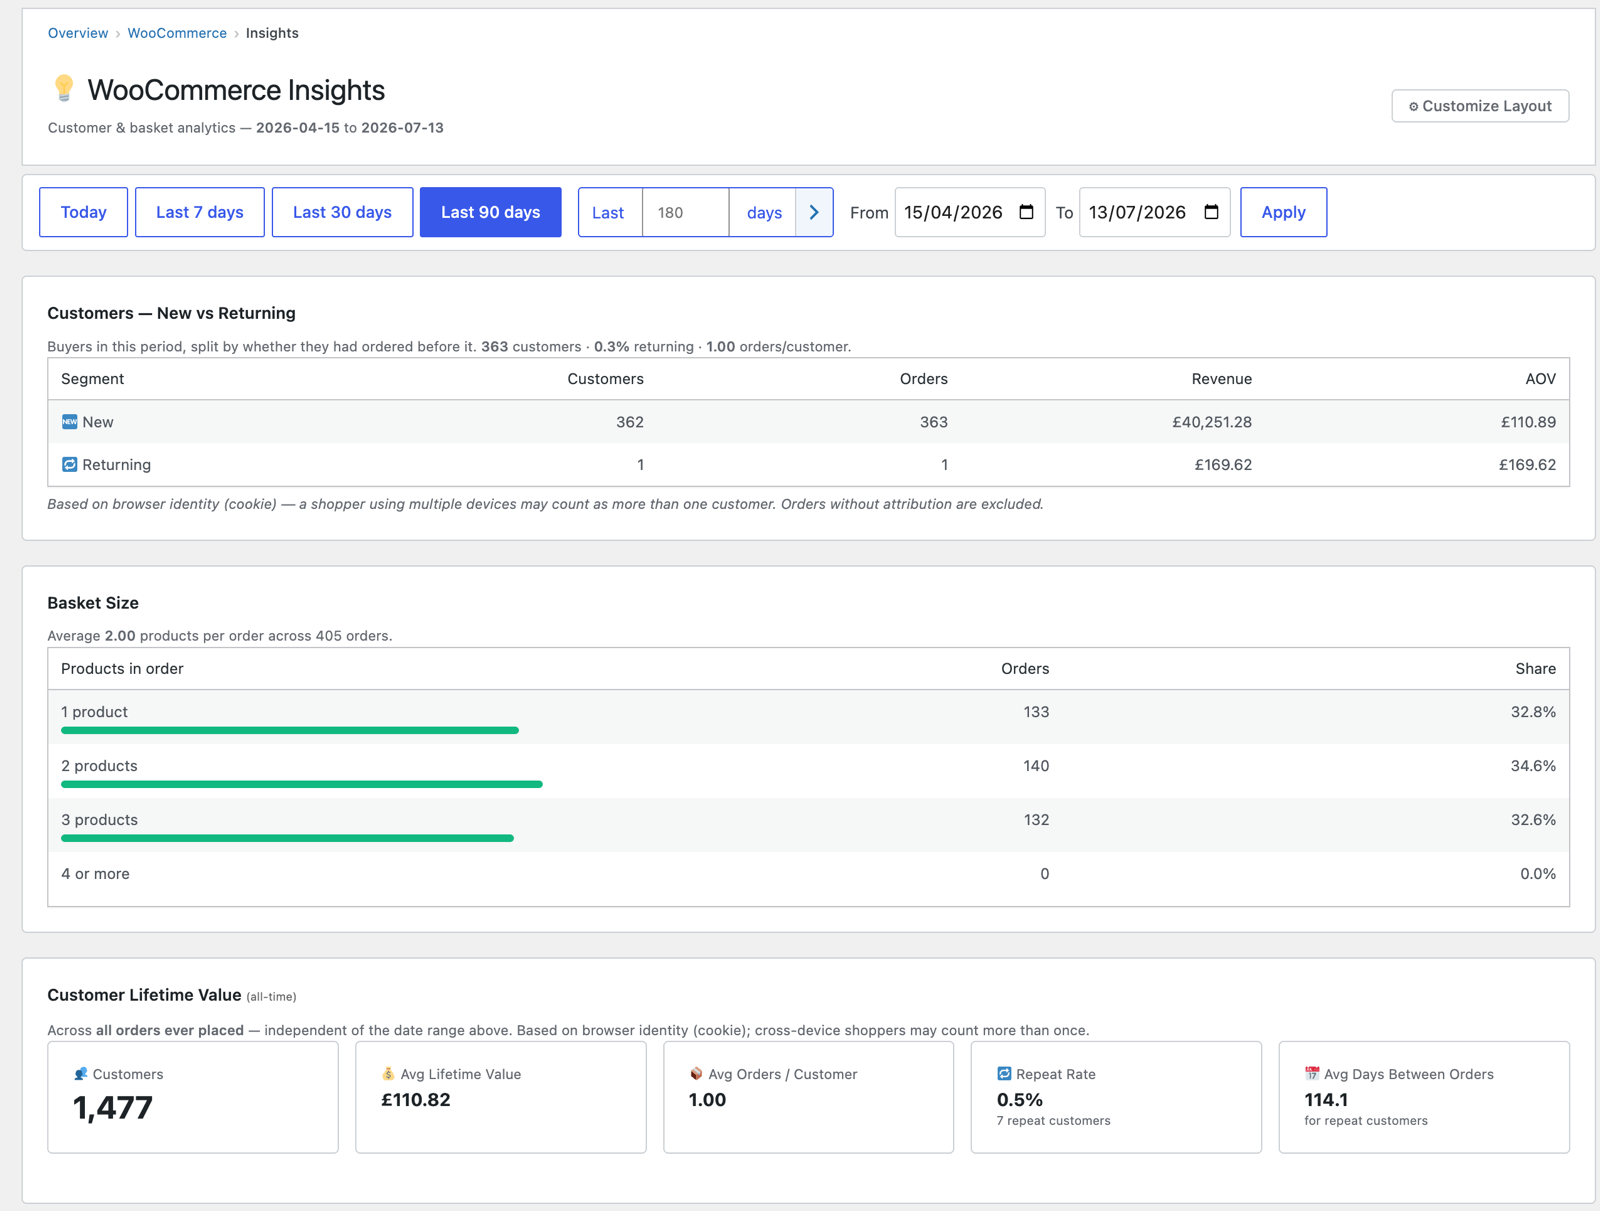
The deeper store analytics (WooCommerce → WC Insights) go beyond headline revenue to the patterns in how your store is bought from — your customer mix, basket size, loyalty and channels — all as aggregate counts, never individual identities:
- Customers — New vs Returning — buyers split by whether they’d ordered before, each segment with its customer count, orders, revenue and average order value.
- Basket Size — how many products go in each order, from single-item to multi-item baskets, with each band’s share.
- Customer Lifetime Value (all-time) — across every order ever placed (independent of the date range): total customers, average lifetime value, average orders per customer, repeat rate and average days between orders.
- Payments & Checkout — orders and revenue by payment method, and orders and shipping collected by shipping method. Payment labels are scrubbed of the customer emails and card-number fragments some gateways embed in their titles (e.g. “PayPal (payer@…)” or “Visa ending in 4242”), so the breakdown stays aggregate — one row per payment method, never one per customer.
- Coupons — which discount codes were used, how often, and the total discount given.
A privacy note on “customers”. Every figure here is an aggregate — a count of distinct shoppers, never a list of them. A “customer” is the same privacy-preserving browser signature PAJ uses everywhere else, not a name, email or address: the plugin never stores or shows who a specific person is or what they individually bought. New-vs-returning and lifetime value are simply counts of those pseudonymous identities. The honest trade-off is that identity is browser-based, so one shopper across two devices (or before and after clearing cookies) can count as two customers — the flip side of not tracking people personally. See Understanding your metrics.
Attribution & conversion paths
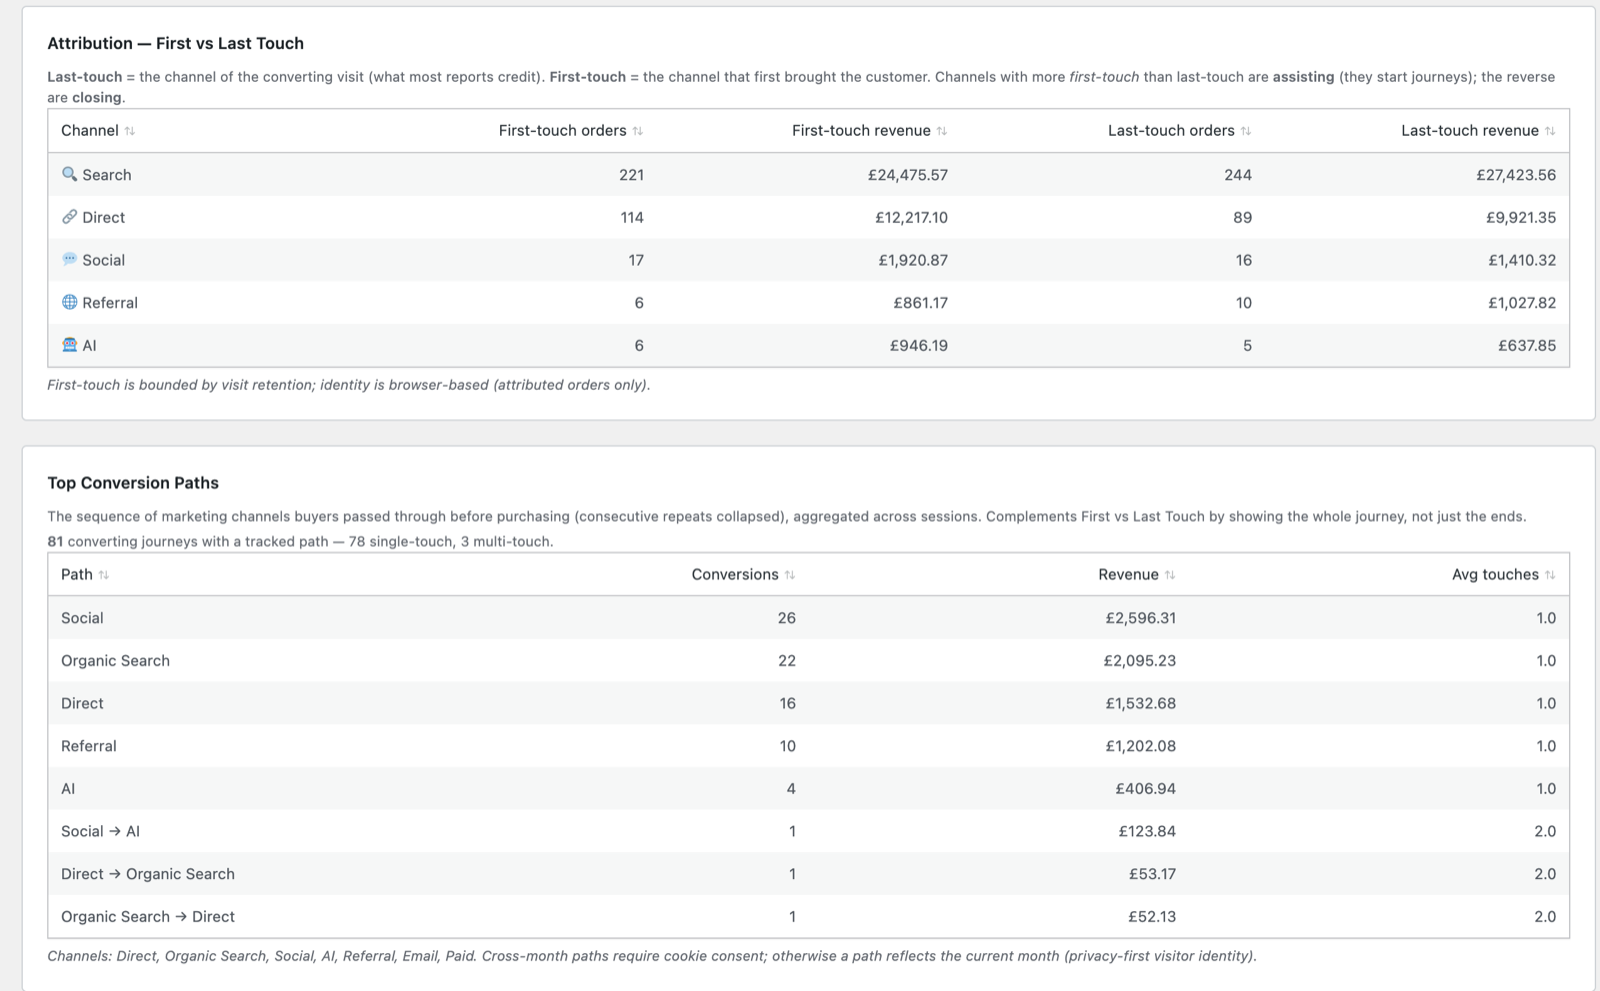
- Attribution — First vs Last Touch — every channel’s orders and revenue under both models side by side. Last-touch credits the channel of the converting visit (what most reports show); first-touch credits the channel that first brought the customer. A channel with more first-touch than last-touch is an assister — it starts journeys others close; the reverse is a closer. Search often closes while social and referral assist.
- Top Conversion Paths — the actual sequence of channels buyers passed through before purchasing (consecutive repeats collapsed), with conversions, revenue and average touches. This is the whole journey, not just the two ends — so you can see, for example, Social → AI or Direct → Organic Search routes that first/last-touch alone would hide. Paths are built exactly like the Goals report’s — one channel per session, threaded on the visitor’s pseudonymous signature over a 30-day lookback — see How a path is built; here they’re anchored on orders, with revenue attached.
- Landing Pages by Revenue and Time to Purchase round out the page, attributing revenue to each order’s entry page and showing how long buyers take from first visit to order.
What to do with it
- A big drop between Add to Cart → Checkout Start points to cart-page or shipping/pricing friction; a big drop at Checkout Start → Purchase points to checkout, shipping, or payment friction.
- Use Product Performance’s two conversion rates to fix the right thing on each product — the page or the checkout.
- Combine revenue by source and the attribution table with Referrers to double down on the channels that actually pay — and value the assisting channels that start the journeys, not just the closers.
Next: Year-on-Year →
Screenshots are illustrative — see the note on the documentation index.