
If you’ve switched to PAJ Statistics from another analytics plugin — or you’re running two side by side to compare — you may notice that PAJ reports fewer views and visitors. The natural first thought is that PAJ is missing traffic.
Almost always, the opposite is true: the other tool is counting traffic that isn’t people.
Where the difference comes from
PAJ Statistics filters automated traffic before it reaches your reports, using several independent layers:
| Layer | What it catches |
|---|---|
| Crawler signatures | Declared bots — search engines, SEO tools, uptime monitors, AI scrapers — matched against the continuously maintained Matomo signature list. |
| Headless & automation detection | Automated browsers (HeadlessChrome, Puppeteer, Playwright, Selenium) that execute JavaScript just like a person’s browser. Many analytics tools count these as visitors — their standard bot list deliberately classifies them as ordinary browsers. |
| Identity checks | Requests with missing, malformed or contradictory browser identities — including clients that fake their identity in JavaScript while the underlying request tells a different story. |
| Rate & volume limits | Hit floods and slow, persistent crawlers (the optional daily per-IP cap). |
| Behavioural flagging | The bots that pass everything above — real Chrome on rotating IPs — get caught by their behaviour: one page, zero interaction, no input signal, whether spread over repeat sessions or burned through in a single sitting. These are badged with the reason, not hidden; see Visitors. |
Every hit rejected by these layers is a view your previous plugin probably counted. On a typical public site that’s a meaningful share of raw traffic — and on a site being crawled hard, it can be most of it.
You don’t have to take this on trust
This is the part that matters. PAJ Statistics shows you the receipt:
- The Overview dashboard displays a line under the headline numbers — “🛡 N hits were filtered as automated traffic in the last 7 days” — so the difference is never invisible.
- Audience → Bot Filtering is the full report: how much was filtered, the trend over time, every rejection reason broken down, and the visitors the behaviour scan has flagged — each with the reason it was flagged.
- Settings → Bot Filtering is where you tune the sensitivity, and shows the same breakdown next to the controls.
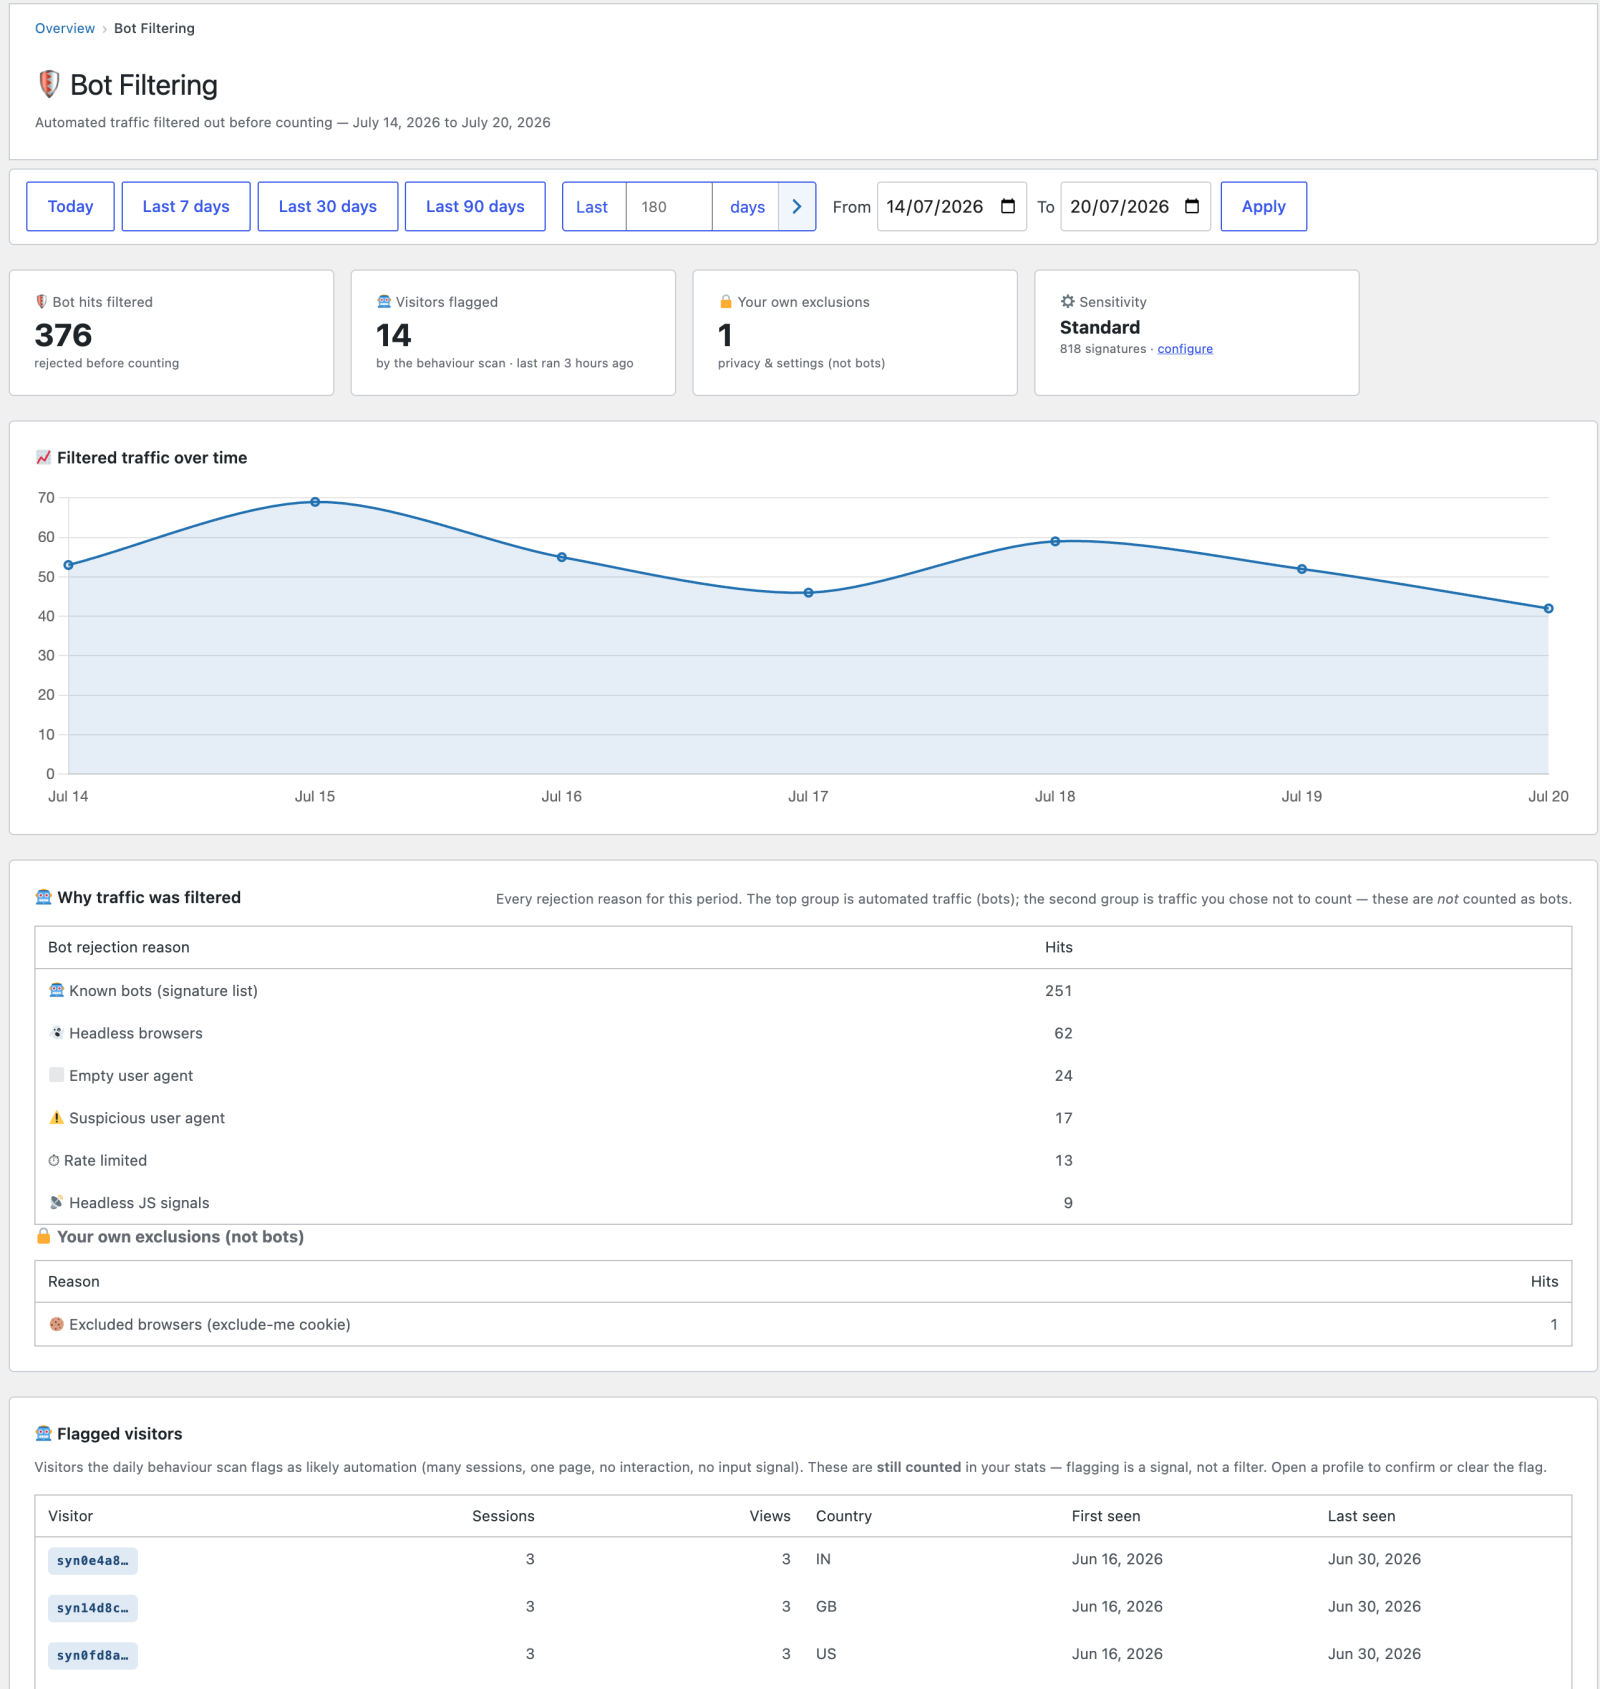
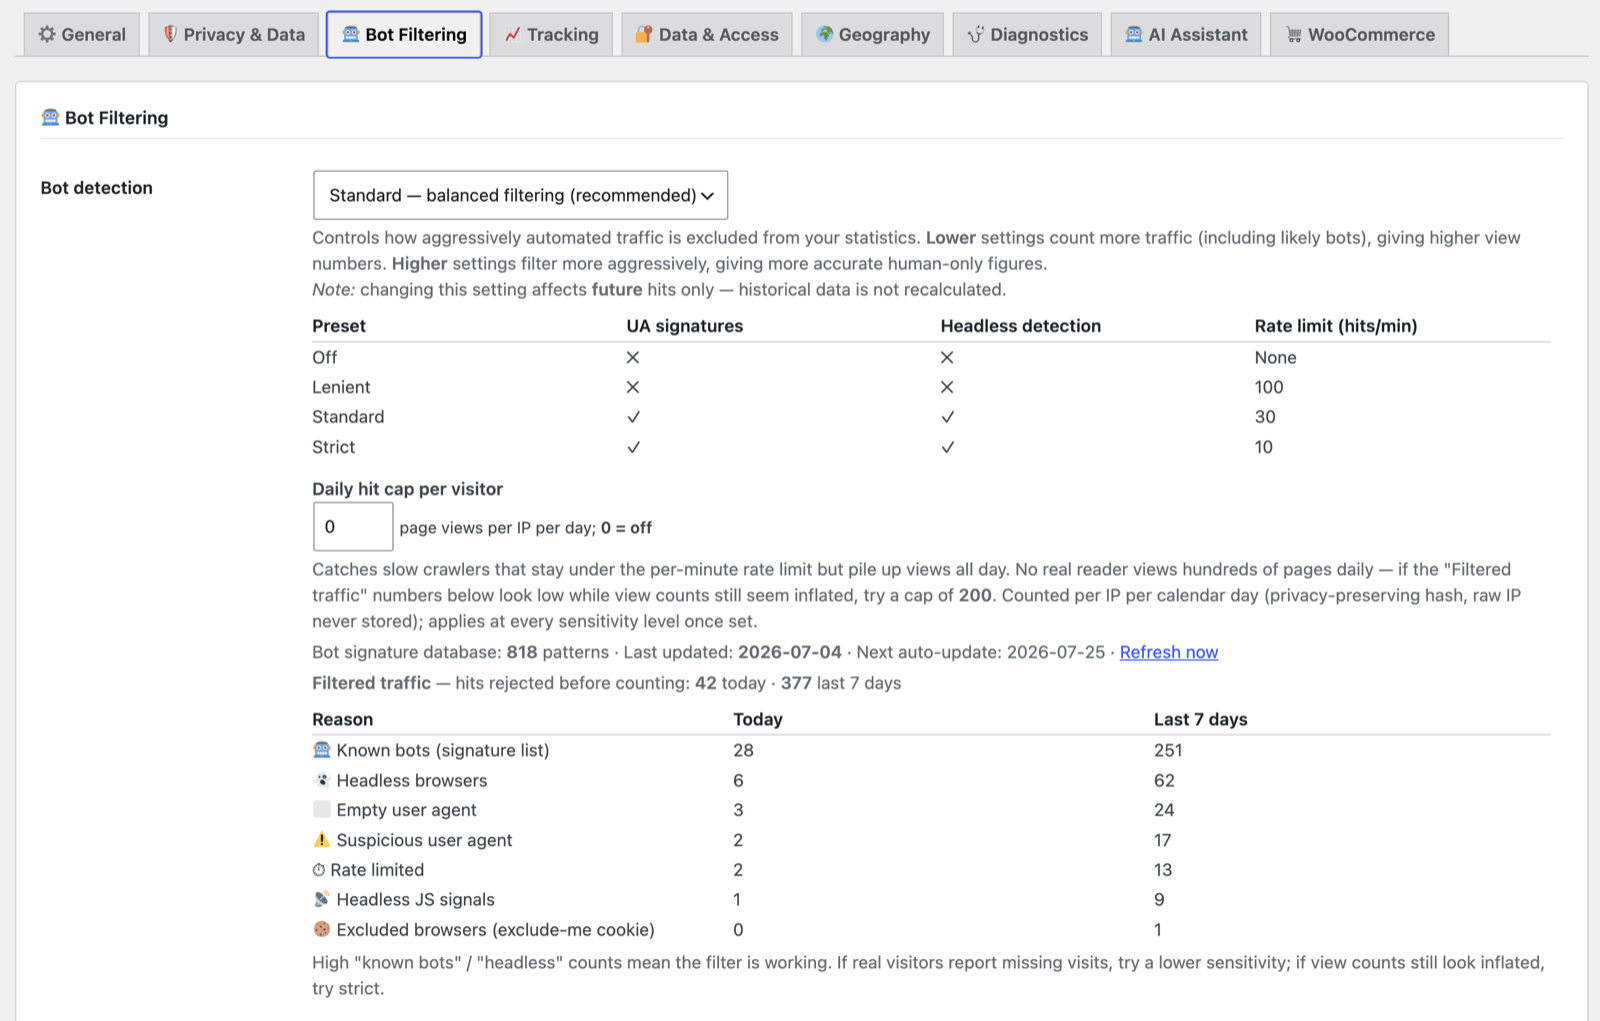
If you’re comparing plugins side by side, open that report. The gap between PAJ’s count and the other plugin’s count should look a lot like the filtered total — that’s the traffic in dispute, itemised.
Some of the difference is your own choices
Separately from bots, PAJ never counts traffic you’ve told it not to:
- visitors who sent a Do Not Track signal (if you honour it),
- visitors without consent, when a consent plugin is active and requires it,
- your own logged-in team (excluded roles) and any excluded IPs.
These appear under their own reasons in the Filtered traffic panel, and they are not included in the Overview’s bot-filtered number — respecting a privacy choice isn’t the same as blocking a bot. Other tools differ here by philosophy: some count non-consenting visitors anonymously by design, which alone can make their totals higher.
When lower really would mean missing
Honest numbers cut both ways, so here’s how to check for genuinely lost visits rather than taking our word for it:
- Filtered traffic panel — a spike under a reason that doesn’t make sense (for example a flood of
invalid_tokenafter a caching change) is worth investigating rather than shrugging off. - Aggressive page caching — if pages are cached for days by a host or CDN, make sure the cache was cleared once after installing or updating the plugin.
- Consent mode — if a consent plugin is active in strict mode, visitors who never answer the banner are not tracked. That’s correct behaviour, but it’s a real difference you should know about. See Settings & Privacy.
The mirror image: time on page runs higher
The same honesty works in the other direction. Because PAJ measures real engaged time (and can measure the last page of a visit, which load-gap-based tools record as zero), your time-on-page will usually be higher than other tools report — and more accurate. See Understanding your metrics.
In short: lower doesn’t mean missing — it means filtered, and you can see exactly what was filtered and why, any time. Numbers you can defend beat numbers that flatter.
For how the filtering actually works — the two layers, the session input chips, the 🤖 suspected-bot badge and your verdicts — see Bot detection explained.
Back to the documentation index.