
The Core Web Vitals screen reports real-user performance — the same metrics Google uses as ranking signals — measured from your actual visitors’ browsers. Open it from Behaviour → Web Vitals. (This is a Pro feature.)
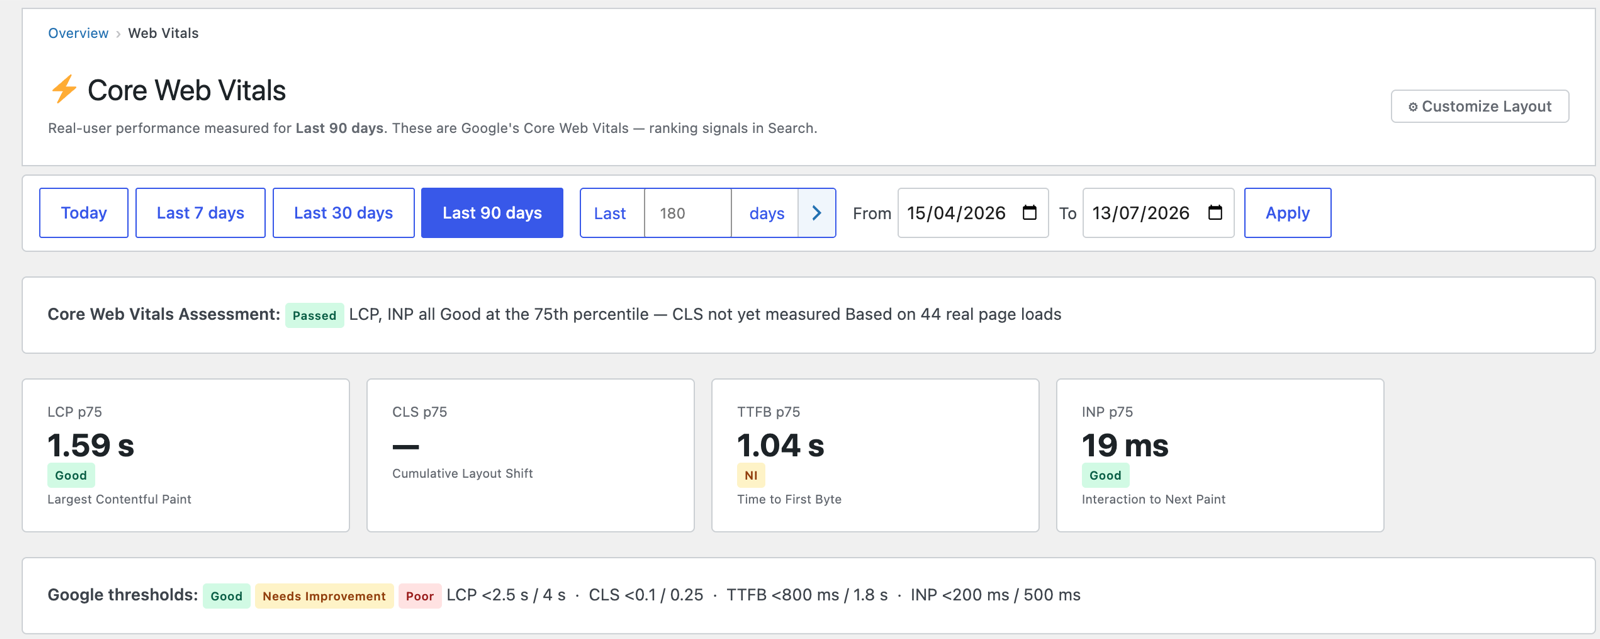
Core Web Vitals Assessment
A single PageSpeed-style verdict — Passed / Needs improvement / Failing — rolled up from the three metrics Google actually uses for its Core Web Vitals assessment (LCP, CLS and INP, judged at the 75th percentile), with a short note explaining which metric holds the rating back and how many real page loads the data is based on. (TTFB is a diagnostic metric, so it’s shown in the cards but doesn’t affect the verdict — same as Google.)
The four metric cards
| Metric | Measures | Google “Good” threshold |
|---|---|---|
| LCP — Largest Contentful Paint | Loading: when the main content appears | < 2.5 s |
| CLS — Cumulative Layout Shift | Visual stability: unexpected movement | < 0.1 |
| TTFB — Time to First Byte | Server responsiveness | < 800 ms |
| INP — Interaction to Next Paint | Responsiveness to clicks/taps | < 200 ms |
The on-screen Google thresholds legend shows the Good / Needs Improvement / Poor cut-offs for each.
What does p75 (the 75th percentile) mean?
Every value on this page is a p75 — the 75th percentile of all real page loads in the period. Here’s what that means:
Imagine lining up every page load from best to worst and walking three-quarters of the way down the line. The value at that point is the p75. So “LCP p75 = 1.59 s” means 3 out of 4 page loads showed the main content within 1.59 seconds — only the slowest quarter took longer.
Why not just use the average? Averages hide bad experiences:
- A handful of lightning-fast loads can mask a large group of slow ones.
- One visitor on terrible hotel Wi‑Fi (or an ancient phone) can wreck an otherwise healthy average, making you chase a problem that isn’t there.
The 75th percentile instead answers the question that matters: “Is the site fast for most of my visitors — including the many on slower phones and mobile connections — while ignoring the worst few outliers?” A metric only rates Good when at least 75% of your visitors got a Good experience.
This is exactly the statistic Google uses to judge Core Web Vitals in its Search ranking assessment — so the numbers you see here correspond directly to how Google sees your site.
Per-Page Breakdown
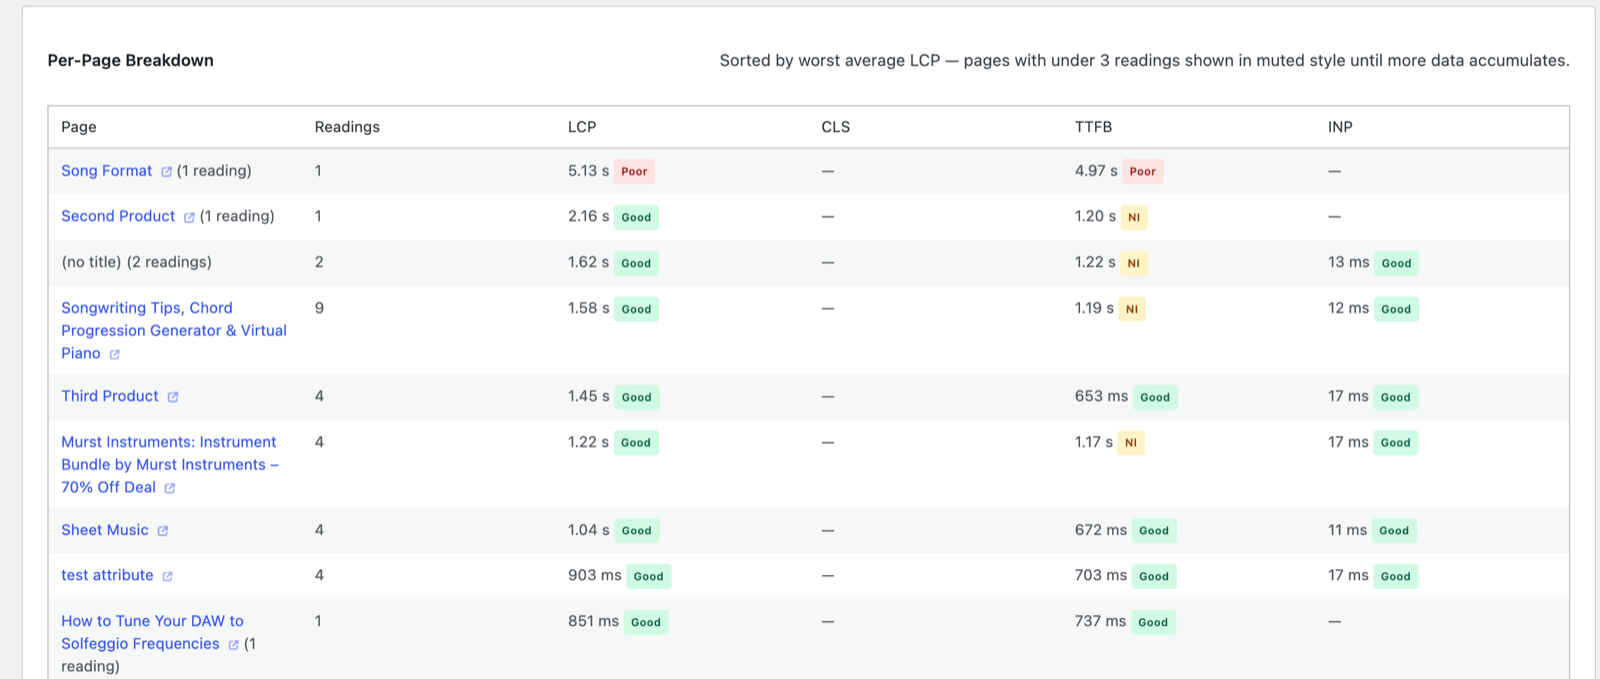
A table of your pages sorted by worst average LCP, with each metric per page. Pages with very few readings are shown muted until enough data accumulates, so you don’t act on noise. Click a page to investigate.
Why it matters
- Core Web Vitals are SEO ranking factors — poor scores can suppress your search visibility.
- Because these are field measurements (real visitors) rather than lab tests, they reflect what your audience actually experiences on their devices and connections.
- Cross-reference poor pages with Devices — issues often concentrate on mobile.
Next: WooCommerce →
Screenshots are illustrative — see the note on the documentation index.