
Installing the plugin
- Upload the
pajstatisticsfolder to/wp-content/plugins/, or install the ZIP via Plugins → Add New → Upload Plugin. - Activate it through the Plugins screen.
- A PAJ Statistics menu appears in your WordPress admin sidebar. Tracking begins automatically — there is nothing to embed in your theme.
The first-run setup wizard
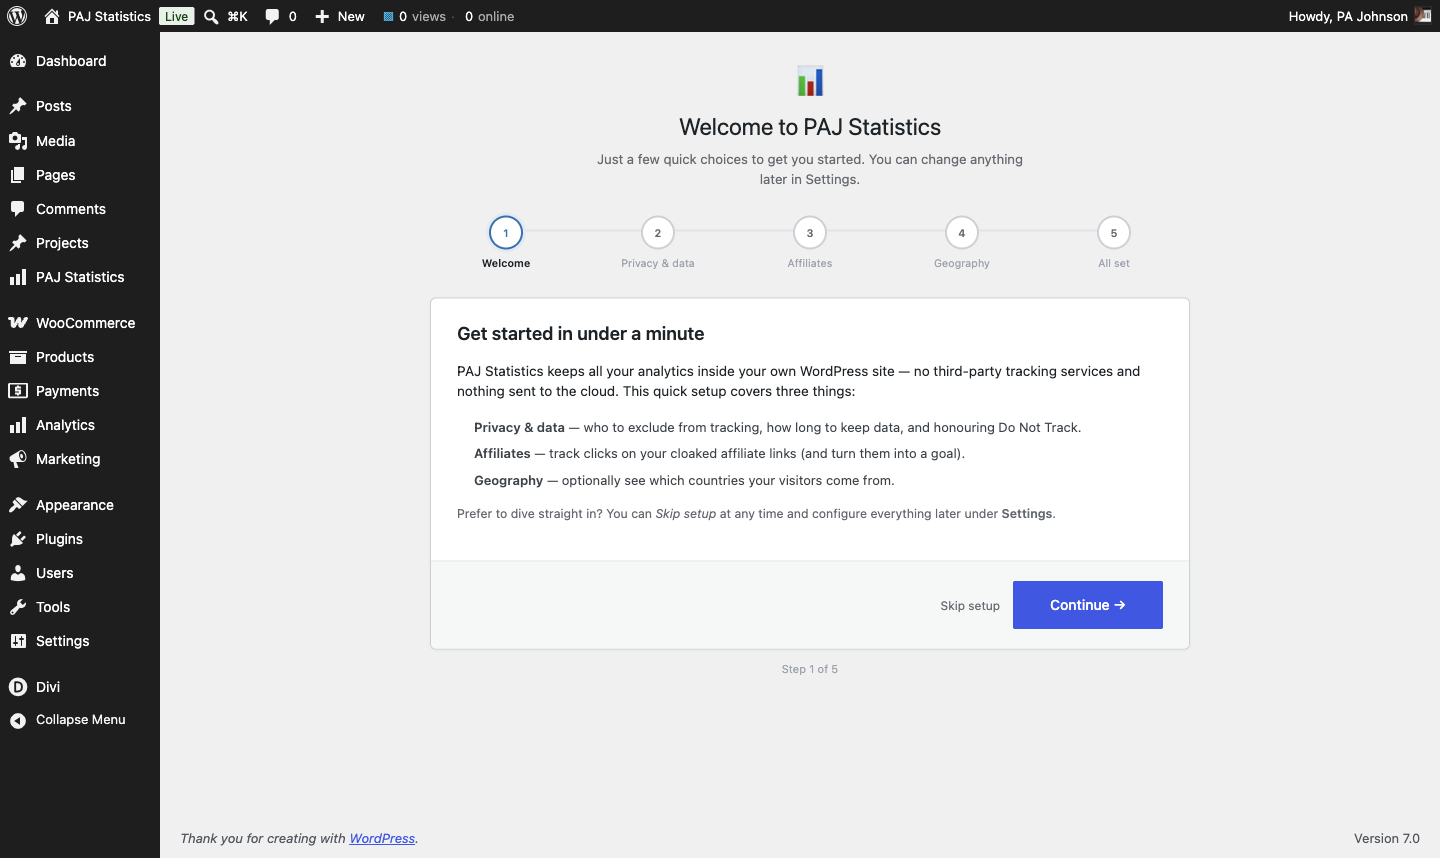
The first time you activate PAJ Statistics, a short, skippable setup wizard opens. It walks you through the handful of choices that matter most — privacy & data (who to exclude, retention, Do Not Track), email reports (a scheduled traffic summary in your inbox, plus optional traffic-spike alerts), and geography detection — and writes straight to the plugin’s normal settings, so anything you choose here can be changed later under Settings & Privacy.
If an affiliate plugin (e.g. ThirstyAffiliates) is detected — or cloaked affiliate paths are already configured — an extra Affiliates step appears with the link path pre-filled. Sites without affiliate links never see that step.
You can safely skip the wizard and configure things later; tracking works with sensible defaults out of the box.
Finding your way around
PAJ Statistics is built as an interconnected web, not a set of flat pages. Two rules cover almost everything:
1. Almost everything in a table is a link. Visitor chips, post titles,
View → buttons, journey routes — if it identifies something, clicking it takes
you to that thing’s own page.
2. Every drill-down has a breadcrumb trail. When you land on a detail page,
the breadcrumbs at the top step you back exactly the way you came — you can
explore freely without getting lost.
The drill-down map
| Click this… | …anywhere it appears | To see |
|---|---|---|
A coloured visitor chip (e.g. a1b2c3d4) | Overview, Visitors, Visits Log, Sessions, session/post detail, WooCommerce abandoned-cart tables | That visitor’s full profile: every visit, session and journey |
| View → in a Details column | Sessions, Journeys, per-post visitor lists, Content tables | The full session path, journey route, or per-post report |
| A post/page title | Content tables, Overview | The live page on your site (opens in a new tab) — use the adjacent View → for its stats detail |
| Visits → on a country or city row | Geography | The Visits Log filtered to that location |
| A referrer name | Sessions, Referrers | The referring website itself (new tab) — handy for checking who linked to you |
| A Quick Navigation card or stat card | Overview | The matching full report |
A visitor chip and its “full profile” are always a pseudonymous signature — a rotating, salted hash, never a name, email or IP — so a profile is just everything that one signature did, not a record of an identifiable person. See Understanding your metrics.
Controls you’ll find on every report
- Date picker — Today / 7 / 30 / 90 days, a custom range, or “last N days”. Your chosen range follows you as you navigate between reports. Pick a single day (Today, or one custom date) and every trend chart switches from day-by-day to hour-by-hour, with the previous day overlaid for comparison.
- ⚙ Customize Layout — drag panels into a different order, hide the ones you don’t use, and resize them. Each report remembers your arrangement per-user — see Customising the layout below for the full tour.
- Sortable columns — headers with arrows sort the table; click again to flip the direction.
- Filter pills (where relevant) — e.g. Device and Engagement on Sessions; the summary cards follow the active filter.
- Export — CSV export on the Reports dashboard, Visits Log and post detail; PDF export from the Overview’s top bar.
- Breadcrumbs — your trail back out of any drill-down.
Customising the layout
Every major screen — the Overview and most reports — has a ⚙ Customize Layout button in its top-right corner. It opens a drawer listing every panel on that page, so each screen becomes something you arrange rather than something you’re given:
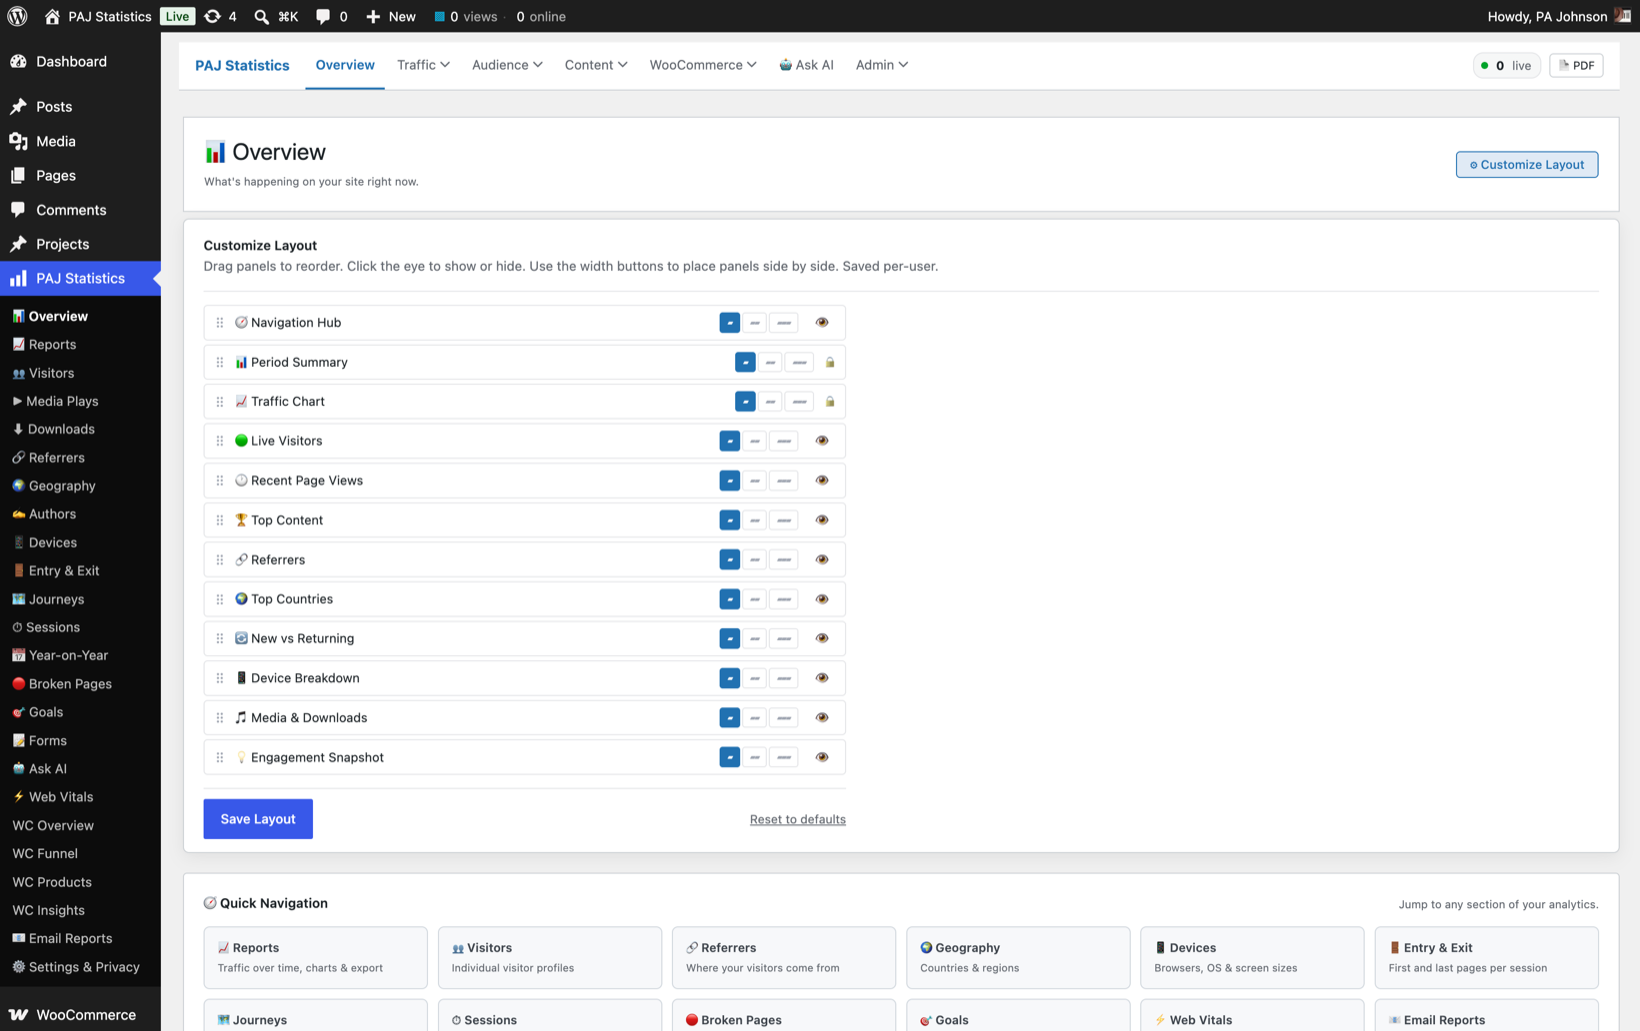
- Drag to reorder — grab the
⠿handle and drag a panel up or down the list. Top-to-bottom in the drawer is top-to-bottom on the page. - Set panel widths — the three width buttons make a panel full width (▰), half width (▰▰) or one-third width (▰▰▰). Neighbouring panels with the same width share a row: set two panels to half and they sit side by side; three one-third panels form a compact 3-across row. It’s the quickest way to turn a long scroll into a dense, dashboard-style page.
- Show or hide panels — click the eye (👁) to hide a panel you don’t use, and click it again (🙈) to bring it back. Hidden panels keep their place in the drawer, so nothing is ever lost.
- Locked panels — a padlock (🔒) marks the panels a screen always keeps visible (on the Overview: the Period Summary and the Traffic Chart). You can still reorder and resize those — you just can’t hide them.
- Save Layout / Reset to defaults — Save Layout stores your arrangement immediately; Reset to defaults returns that screen to its factory layout without touching any other screen.
Two details worth knowing:
- Layouts are per-user and per-screen. Your arrangement is saved against your own WordPress user, so an editor and an administrator can each shape the same report differently — and every screen remembers its own layout independently.
- Updates never disturb your arrangement. When a plugin update adds a new panel to a screen, it simply appears at the end of your saved layout, ready to be dragged into place.
Requirements
- WordPress 5.8 or newer (WordPress 7.0+ is required only for the built-in Ask AI assistant).
- PHP 7.4 or newer.
- WooCommerce is optional — the WooCommerce reports only load when WooCommerce is active; everything else works on any site.
Where your data lives
All tracking and reporting happens on your own server. Visitor data is stored in custom tables in your site’s database (prefixed pajstatistics_) and is never sent to an external analytics service. The only feature that ever contacts an outside service is the optional Ask AI assistant, and only when you use it — see Ask AI.
Finding your way around
The plugin is organised into a top tab bar and a left-hand menu:
- Overview — the at-a-glance dashboard (see Overview dashboard).
- Traffic / Audience / Content / Behaviour / WooCommerce / ASK AI / Admin — grouped menus across the top that mirror the left sidebar.
- Customize Layout — most report screens let you show, hide, and reorder their panels with the ⚙ Customize Layout button (top-right). Your arrangement is saved per screen.
- Date range picker — every report except the Overview page has a date selector near the top (Last 7 / 30 / 90 days, This month, or a custom range). Changing it updates every panel on the page.
PAJ also shows you numbers without opening its menu at all — a Traffic Summary widget on your WordPress Dashboard, a stats box in the post editor, and live counts in the admin bar. See At a glance.
Next: Understanding your metrics →
Screenshots are illustrative — see the note on the documentation index.